
Featured Map March 2021
Students in Professor Liping Yang’s course GEOG 485/585 (Internet Mapping) created interactive, web-based maps for their final projects in Spring 2021. Explore these creative and engaging maps!
- Visually Exploring Environmental Variables (Kohala, HI) (web app, demo video)
(by Katherine Peck)
A web-based visual analytics tool for visually exploring environmental variables in Leeward Kohala, HI.
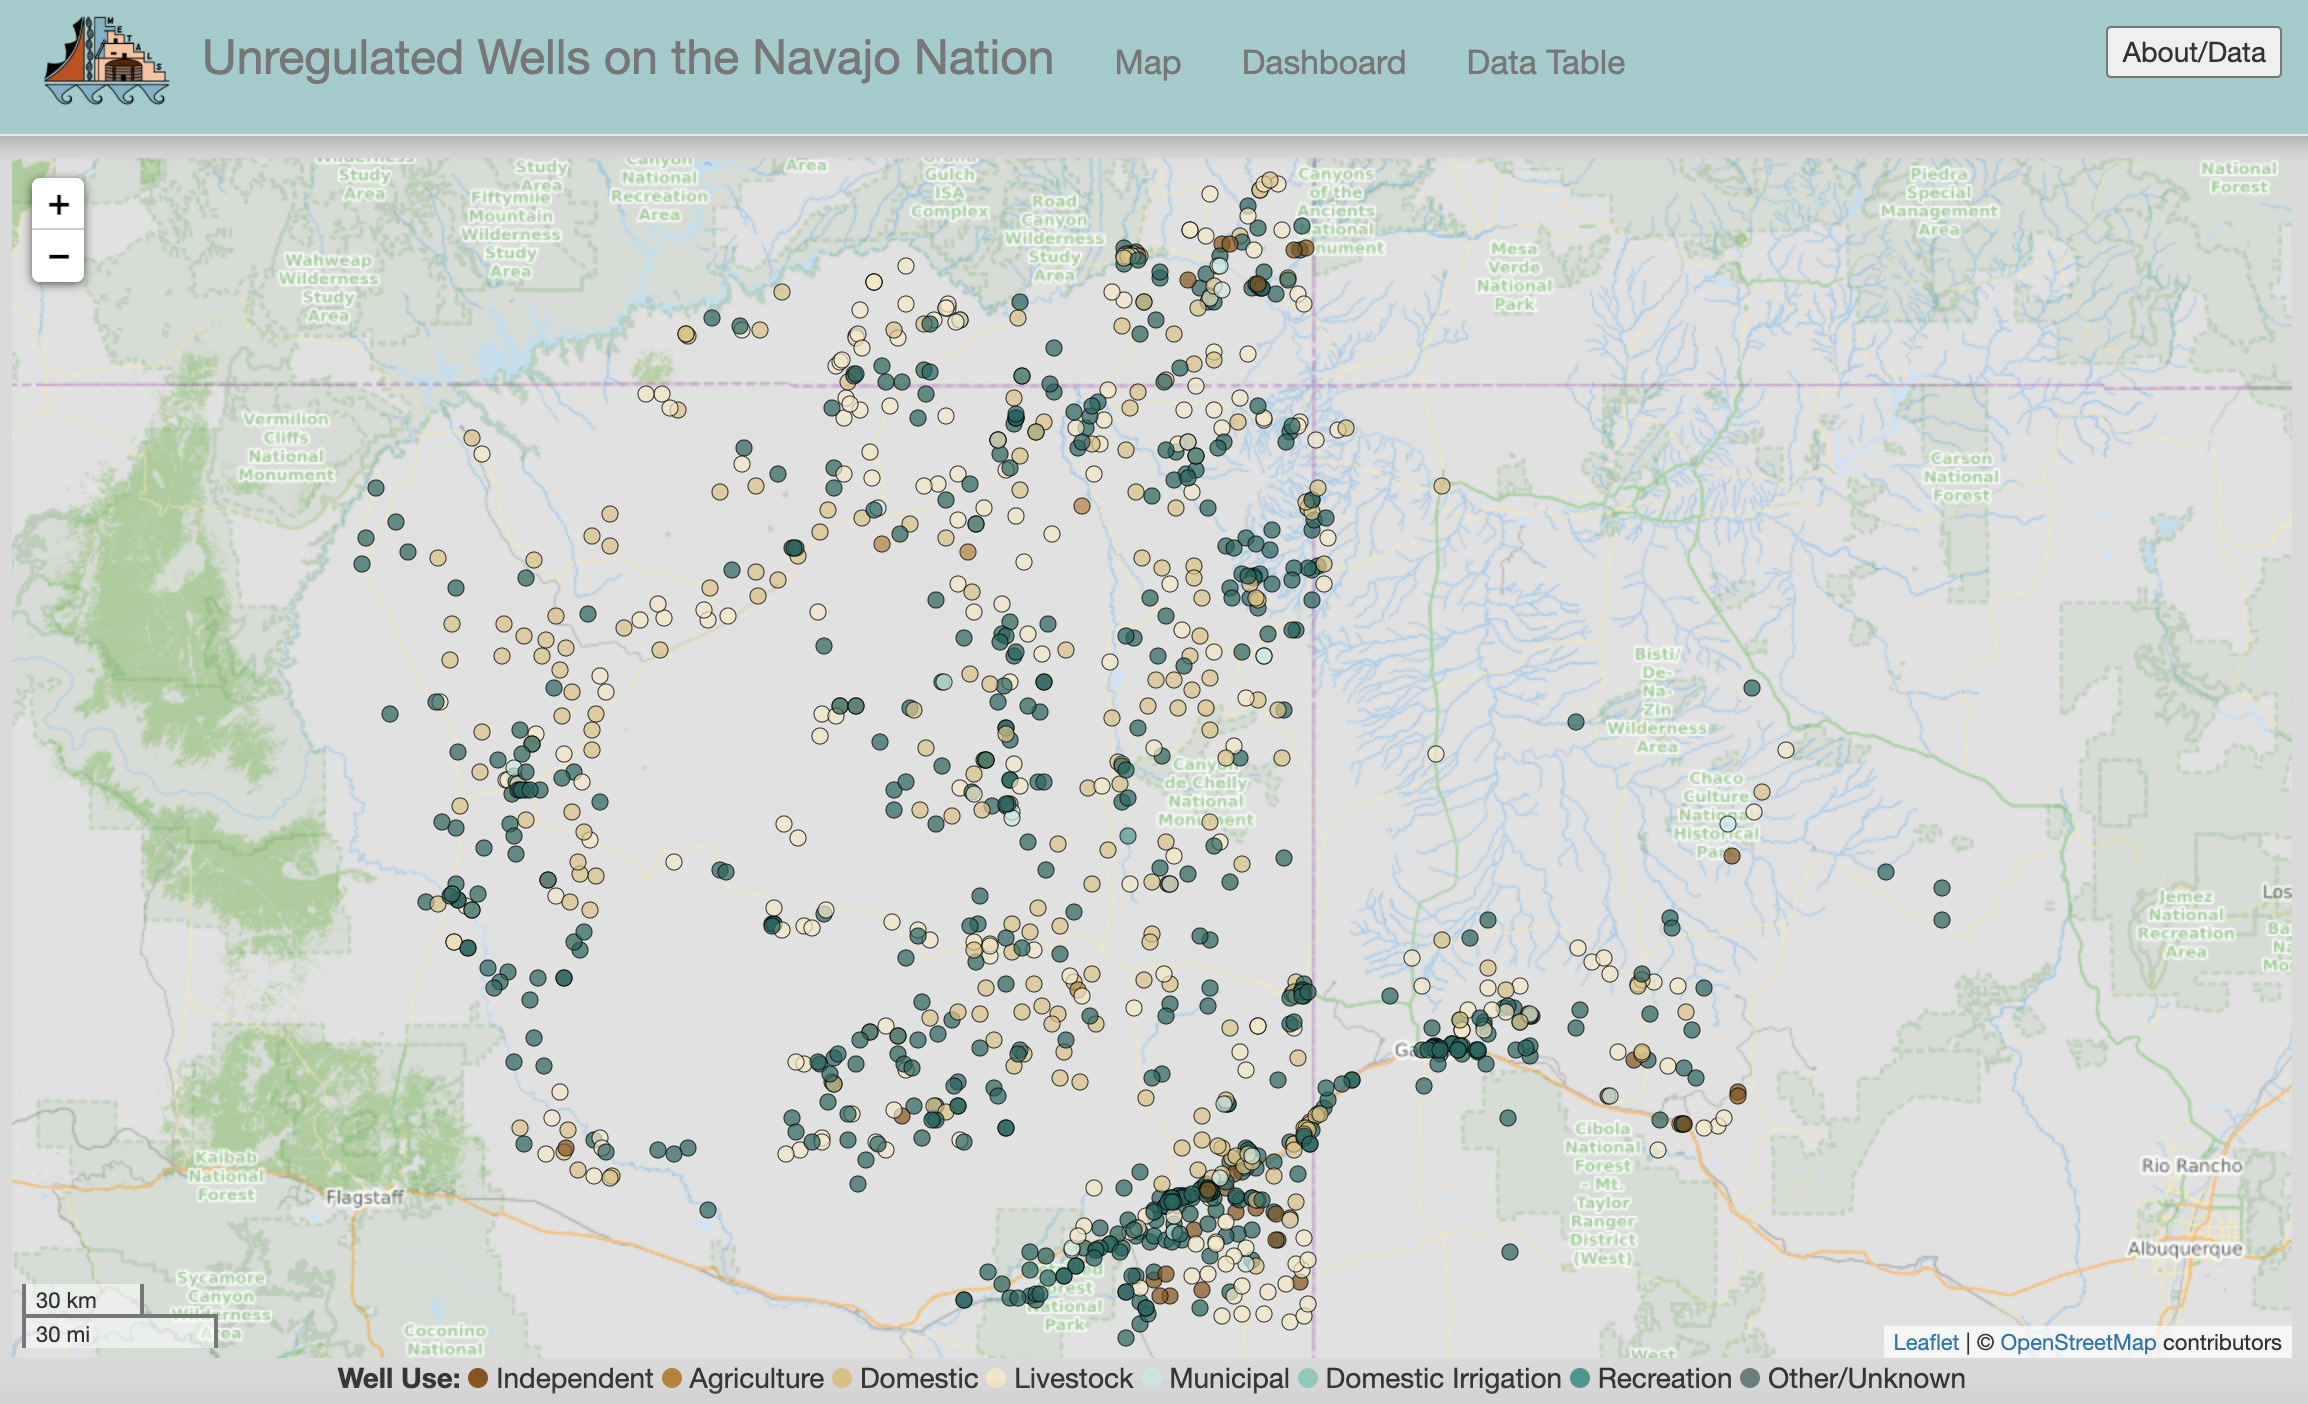
- Water Quality at Unregulated Wells in the Navajo Nation (web app, demo video)
(by Daniel Beene and Manideep Potluru)
An interactive web map for water quality at unregulated wells in the Navajo Nation, empowered by coordinated-view visualization through cross-filter.
- Worldwide Shark Attacks (5 A.D. to 2018) (web app, demo video)
(by Sarigai Sarigai)
An interactive web map for visualizing worldwide shark attacks, empowered by coordinated-view visualization through cross-filter and animated choropleth maps (5 A.D. to 2018).
- Bosque Ecosystem Monitoring Program Interactive Data Explorer: Depth to Groundwater (1997-2017) (web app, demo video)
(by Rowan Converse and Blair Mirka)
An interactive web map for visually exploring the Bosque Ecosystem Monitoring Program depth to groundwater (1997-2017), empowered by a multiple chart with brushing and zoom function that automatically updated and according to the selected site on the map component.
- Worldwide Alcohol Consumption (1835-2019) (web app, demo video)
(by Chris Girlamo)
An interactive web map for visualizing worldwide alcohol consumption (1835-2019), through a sequence of choropleth map, along with corresponding pie chart and histogram, enabled by a time slider -- note that the current version mainly works on Firefox (the time slider functionality), not working on Google Chrome web browser.
- Visualization of biological trait data from natural history collections (web app, demo video)
(by Chauncey Gadek and Caleb Garrett)
An interactive web map for visualizing bird oxygen transport trait data across collection sites in South America, empowered by coordinated-view visualization through cross-filter.
