Map of the month August18
UNM PhD student is localizing climate data to help decision-makers
Across the globe, climate change is having a range of different impacts. Understanding what’s happening on a local level can track those changes over time, and help drive better decision-making.
Using records from more than 100 meteorological stations near Pedro Moncayo, Ecuador, UNM doctoral student Natali Cáceres-Arteaga and her colleagues tracked precipitation and temperature changes from 1981 through 2017 and modeled predictions of future climate scenarios for 2030 through 2050.
It’s the first study to illustrate climate scenarios at a local scale there. And as they write in a paper recently submitted to Revista Geografica de Central America, they’re hoping it will help vulnerable communities strengthen their planning and adaptation capacities.
"I think it's really important for scholars in the developing world to set research agendas that match up to local needs in meaningful ways, rather than relying on outside scholarship to set the agenda for them,” says Dr. K. Maria Lane, Chair of UNM’s Department of Geography and Environmental Studies. “This map is a great example of the kind of analysis that was desperately needed in Ecuador, but no one had ever taken the time to provide."
Cáceres-Arteaga is on the faculty at Universidad Central del Ecuador while simultaneously earning a PhD at the University of New Mexico through the Latin American Studies program. She spent two years at UNM engaged in coursework in GES and CRP.
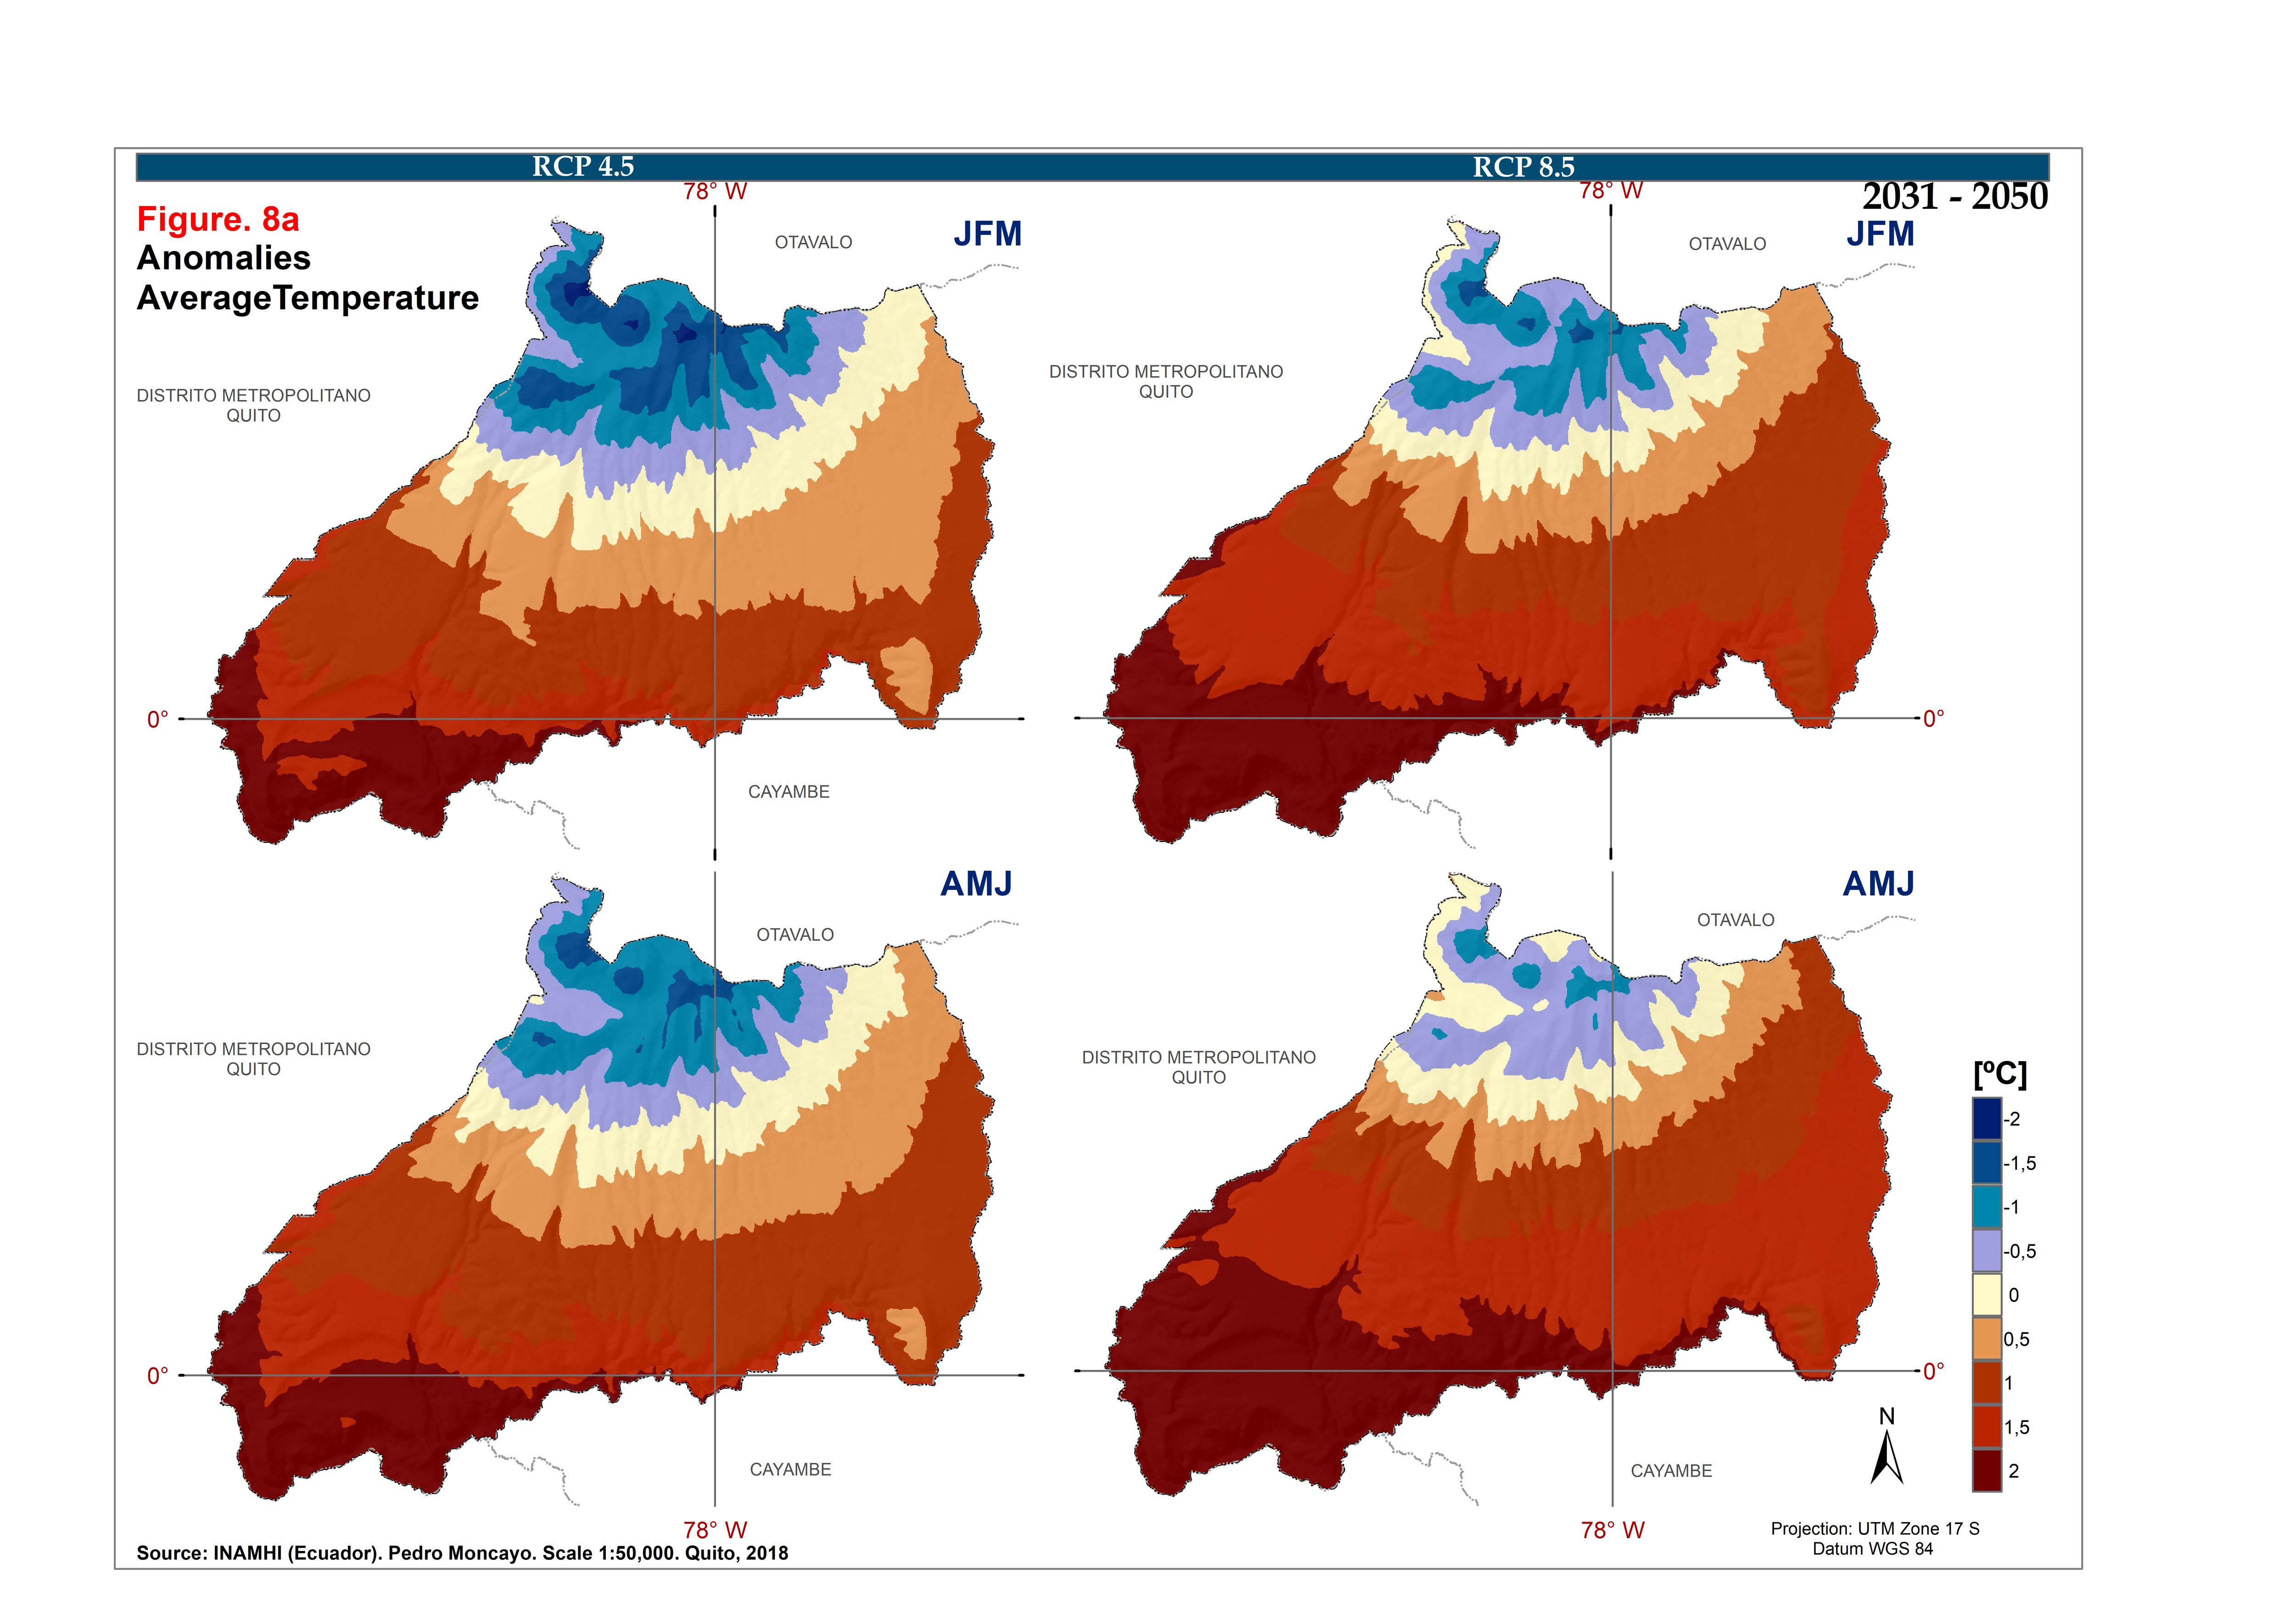
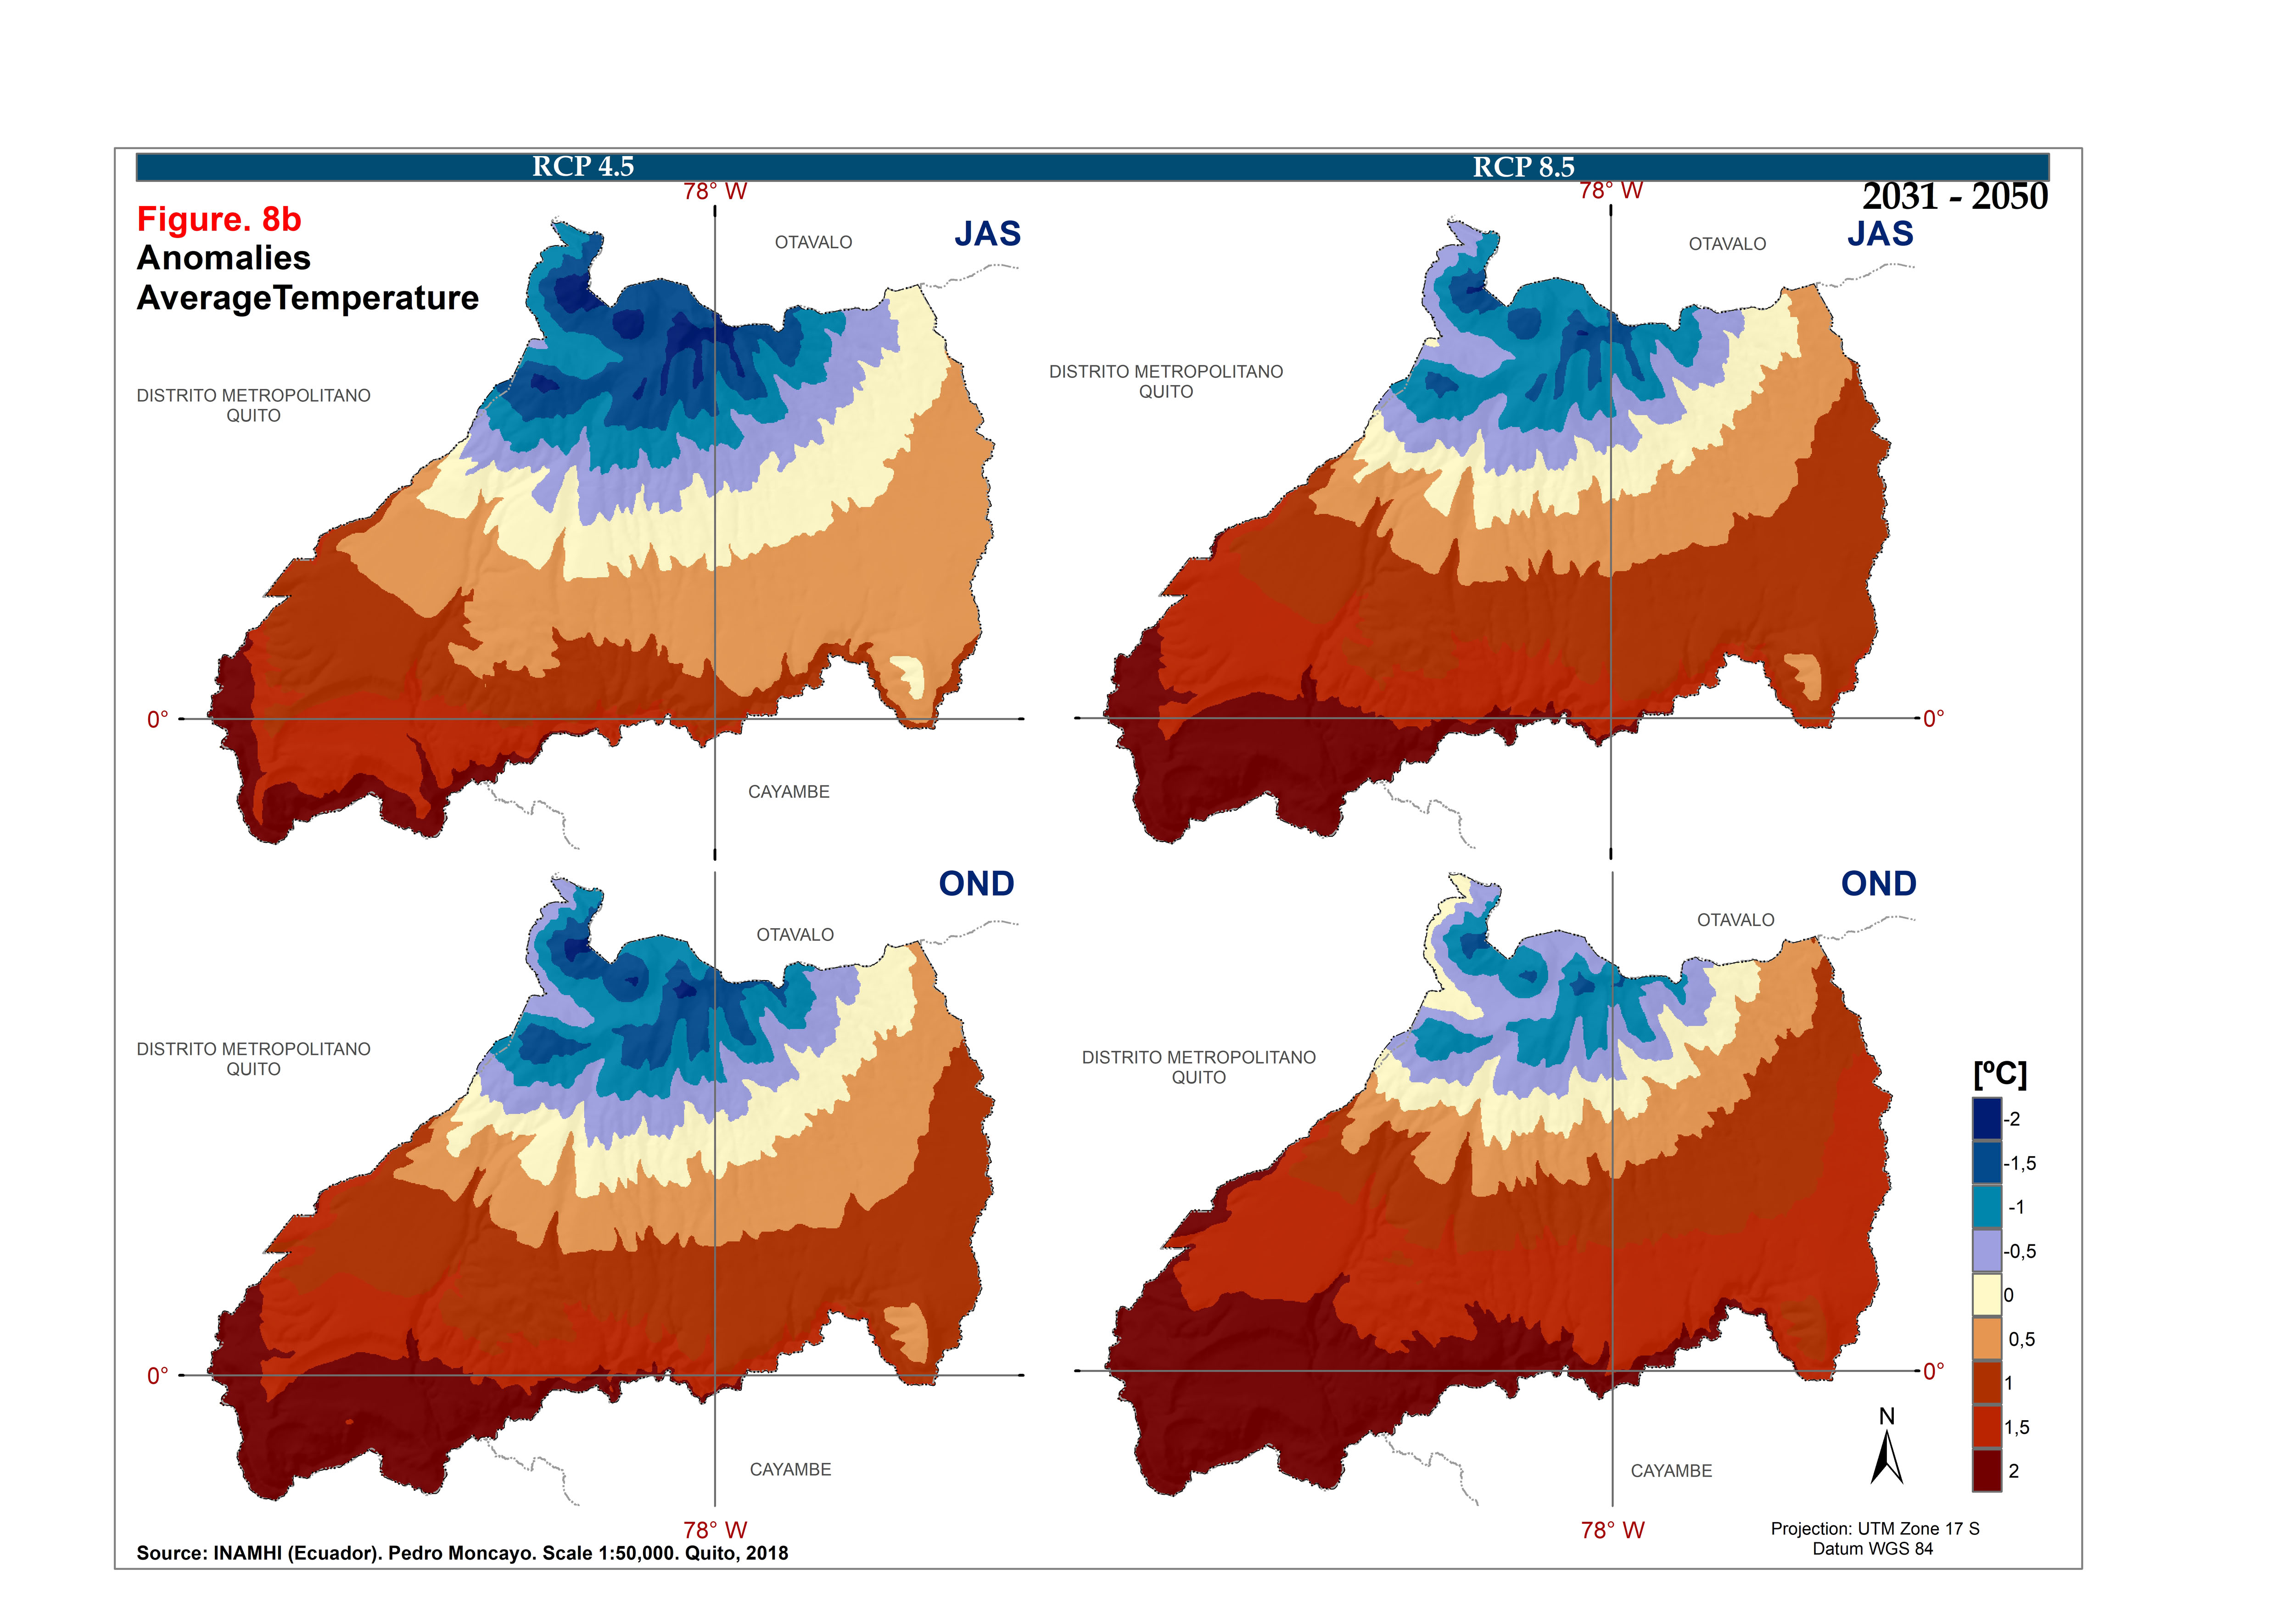
Cáceres-Arteaga and her colleagues focused their analysis on localized changes in the geographic distribution of precipitation and maximum and minimum temperature throughout the year. Based on international greenhouse gas emission scenarios, their study anticipates that people living in the Pedro Moncayo region can expect colder nights and hotter days in the future, and precipitation increases in most areas.
One of the most difficult parts of the study was finding the appropriate local-level scale of analysis for their study. That’s because the magnitude and direction of temperature and precipitation changes vary depending on the local topography.
In their paper, Cáceres-Arteaga, Oscar Ayala, Darwin Rosero, and Lane include almost a dozen maps, showing temperature and precipitation variations. For example, to identify trends in this highlighted “Map of the Month,” they calculated the anomaly of the average temperature between current climate (1982 through 2017) and future climate (2030 through 2050) for an intermediate and a pessimistic scenario, trying to show what could be a worst-case scenario in the future for communities.
“This research is for the people, and a contribution for their planning process at local level,” says Cáceres-Arteaga. “I truly believe this is the right way of doing research at an academic level.” She advises fellow academics to make a real contribution to the communities they study, and to eliminate past colonial and patriarchal practices.
Now, Cáceres-Arteaga is back in Ecuador completing her dissertation research and teaching her own students.
“I am very excited about these first results of my dissertation, and incredible thankful to the Geography Department at UNM, and specially to my Committee Chair, Dr. Lane,” says Cáceres-Arteaga. “She has been supporting me all the way until now, sharing her knowledge and finding ways of motivating me to do my best effort.”
Lane visited Ecuador over Spring Break 2018, which was a great opportunity for both women to connect with one another, the research and study area, and Central University authorities.
"Natali already had a background in environmental law, engineering, and policy before she came to UNM,” says Lane. “It's been really exciting to see her develop a deeper understanding of spatial analysis and cartography through her dissertation work at UNM."
Cáceres-Arteaga says GES provided funding for multiple professional conferences, including the American Association of Geographers annual meetings in San Francisco (2016) and Boston (2017), as well as the Conference of Latin Americanist Geographers meetings in New Orleans (2017) and San José de Costa Rica (2018). “In all of those meetings I have been able to present my research, get valuable feedback and meet colleagues from all over the world,” she says.
And now, Cáceres-Arteaga’s “Map of the Month” can help other scholars consider how they might localize climate data, and help communities and decision-makers envision the coming changes.
